A place to discuss hardware/software and diagnostic procedures
Know good waveforms
- tim.smith1
-
 Topic Author
- Offline
- Premium Member
-

Less
More
- Posts: 149
- Thank you received: 61
7 years 1 day ago #31833
by tim.smith1
Know good waveforms was created by tim.smith1
Just a spot to post known good waveforms
The following user(s) said Thank You: simclardy
Please Log in or Create an account to join the conversation.
- The_Floss
-
- Offline
- New Member
-

- Unwaxed with a hint of peppermint
Less
More
- Posts: 16
- Thank you received: 4
6 years 8 months ago - 6 years 8 months ago #34615
by The_Floss
Replied by The_Floss on topic Know good waveforms
I've attached a comparison of a known good cat (2006 Toyota Sienna) with a dead cat (2003 Toyota Camry) for the exact same route at approximately the same speeds and driving conditions.
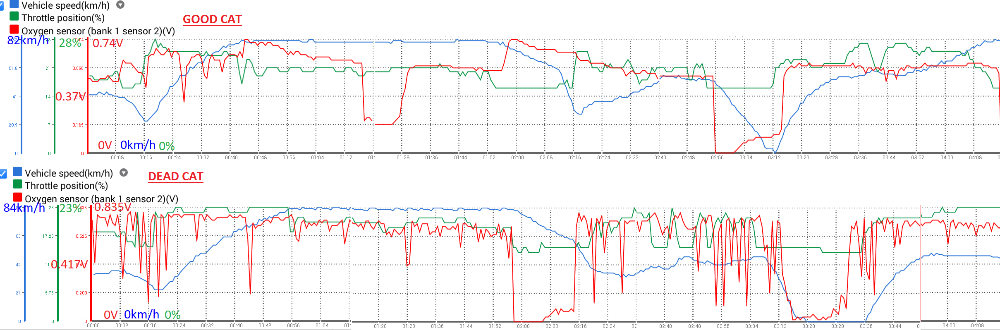
The top is the O2 data for the good cat, and the bottom is for the dead one.
Both cars have upstream A/F Sensors, and fuel trims below 4% at all loads.
-Cheers
EDIT: I noticed that you couldn't see the values of the y axis with the low resolution, so I've added the upper and lower bounds for all 3 data PIDs, as well as the mid value for O2 output in large text. Hope that helps.
Last edit: 6 years 8 months ago by The_Floss.
The following user(s) said Thank You: Noah
Please Log in or Create an account to join the conversation.
Time to create page: 0.223 seconds