Volumetric Efficiency
- SheetsTech
-
 Topic Author
- Offline
- Junior Member
-

- Posts: 29
- Thank you received: 10
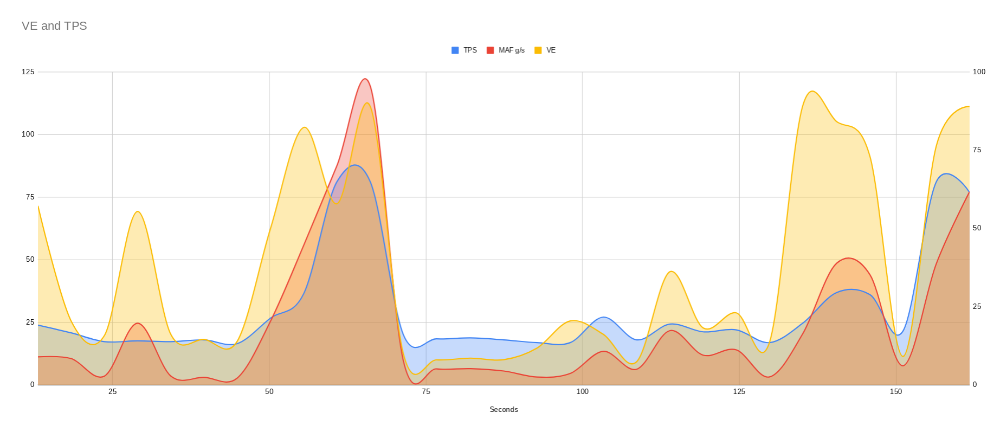
My two full throttle runs show the VE hitting 108% and 139% which I am convinced is good breathing.
Please Log in or Create an account to join the conversation.
- Ben
-
- Offline
- Platinum Member
-

- Posts: 1098
- Thank you received: 215
Sent from my SM-G781V using Tapatalk
Please Log in or Create an account to join the conversation.
- Tyler
-
- Offline
- Moderator
-

- Full time HACK since 2012
- Posts: 6126
- Thank you received: 1542
My two full throttle runs show the VE hitting 108% and 139% which I am convinced is good breathing.
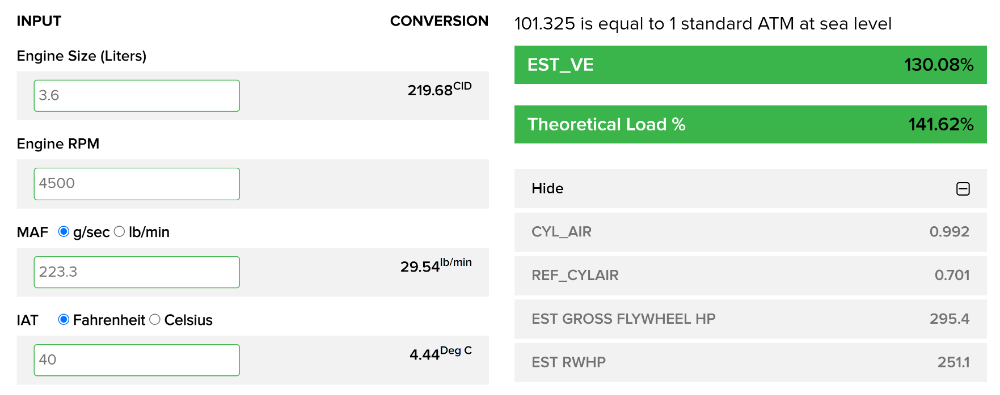
139%? :woohoo: That's moving some air! No offense, but are you positive you've got the calculation set up correctly? Because I don't think I've ever seen a 2AZ have that kind of volumetric efficiency. I'd expect more in the 85-90% range. Is this tC supercharged?
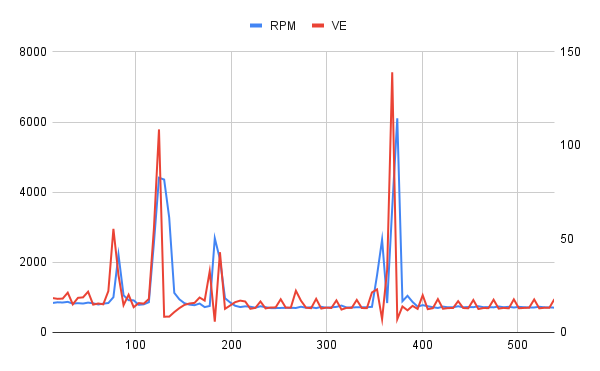
One question I have is at idle, the VE is horrible and there are rythmic little humps every few seconds. Are these humps telling me something I need to investigate further
The terrible VE at idle is pretty normal. :silly: At idle, the engine is breathing a minimum amount of air, and the VE numbers reflect that.
The regular humps in the VE line... Is the A/C on? Defroster? That's about the right frequency for the A/C compressor clutch to come on and off in low ambient temperatures. Any kind of engine load changes will cause the throttle plate/IAC valve to change the idle airflow, which will show up in your VE calculation.
Please Log in or Create an account to join the conversation.
- SheetsTech
-
Topic Author
- Offline
- Junior Member
-
- Posts: 29
- Thank you received: 10
MAF = grams/second
P = barometric pressure in pascals
IAT = intake temp in kelvin
D = P / (287 * IAT)
The only issue I have with how it runs is the rough idle. Maybe a smoke test for vacuum leaks?
Please Log in or Create an account to join the conversation.
- SheetsTech
-
Topic Author
- Offline
- Junior Member
-
- Posts: 29
- Thank you received: 10
And then I checked my results against this calculator.
atgtraining.com/atg-volumetric-efficiency-calculator/
They check against each other. I got my atmospheric pressure from the airport website.
I thought 139% was ridiculous too and no supercharger. Crappy data collector?
Thanks all.
Please Log in or Create an account to join the conversation.
- Matt T
-
- Offline
- Platinum Member
-
- Posts: 751
- Thank you received: 276
I'm not familiar with the software your using but I'm pretty sure there is a issue in capture rate which is leading you to have incorrect VE readings .
That sure looks to be at least part of the issue with those VE numbers. OBD-II can take a second or more to loop thru' the PIDs required for a VE calculation. Way too long when RPM is increasing by over 1,000 RPM per second. Best to do a VE pull in a high gear.
Please Log in or Create an account to join the conversation.
- Tyler
-
- Offline
- Moderator
-
- Full time HACK since 2012
- Posts: 6126
- Thank you received: 1542
I thought 139% was ridiculous too and no supercharger. Crappy data collector?
Partly that? The scan data rate from this era of Toyota product wasn't screaming fast, either. :silly:
For giggles, I stuck some known good values into the ATG calculator:
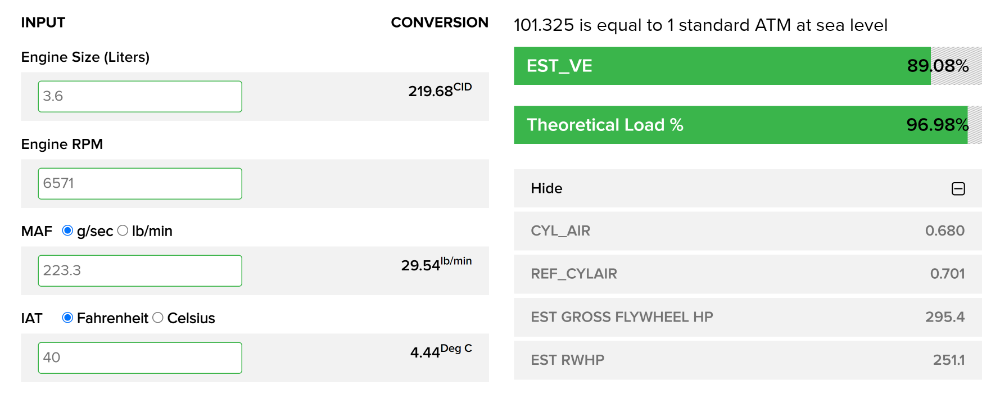
Then I reduced the RPM by 2,000 and left all the other values the same:
Please Log in or Create an account to join the conversation.
- SheetsTech
-
Topic Author
- Offline
- Junior Member
-
- Posts: 29
- Thank you received: 10
Please Log in or Create an account to join the conversation.
- SheetsTech
-
Topic Author
- Offline
- Junior Member
-
- Posts: 29
- Thank you received: 10
Please Log in or Create an account to join the conversation.
- SheetsTech
-
Topic Author
- Offline
- Junior Member
-
- Posts: 29
- Thank you received: 10
Please Log in or Create an account to join the conversation.
- Paul P.
-

- Offline
- Platinum Member
-
- Posts: 457
- Thank you received: 195
What are your fuel trims doing more importantly?
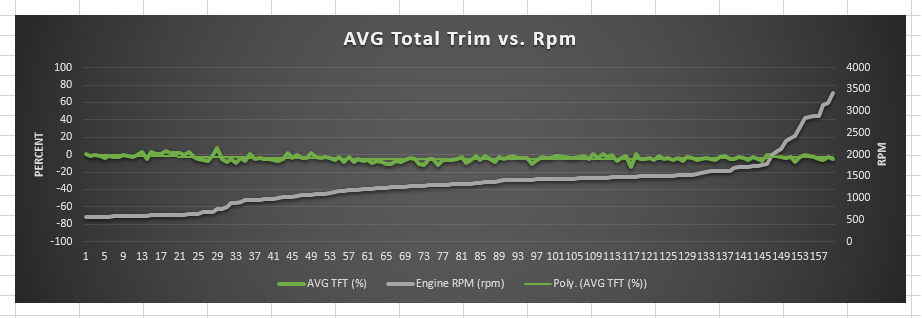
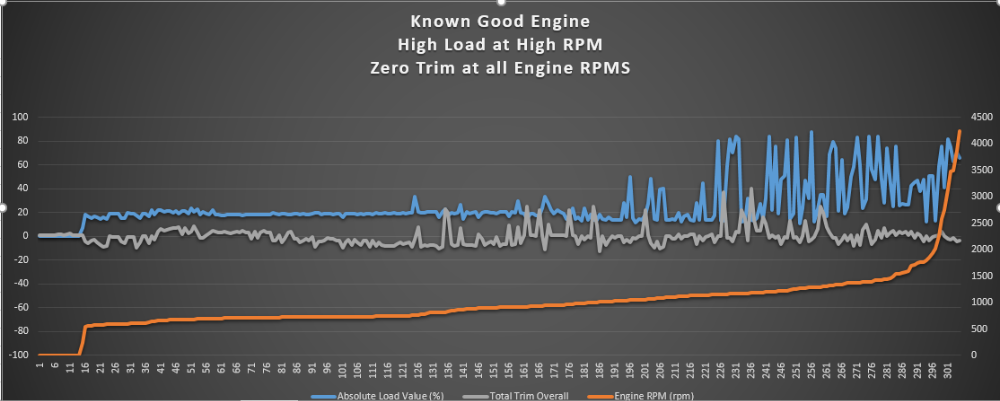
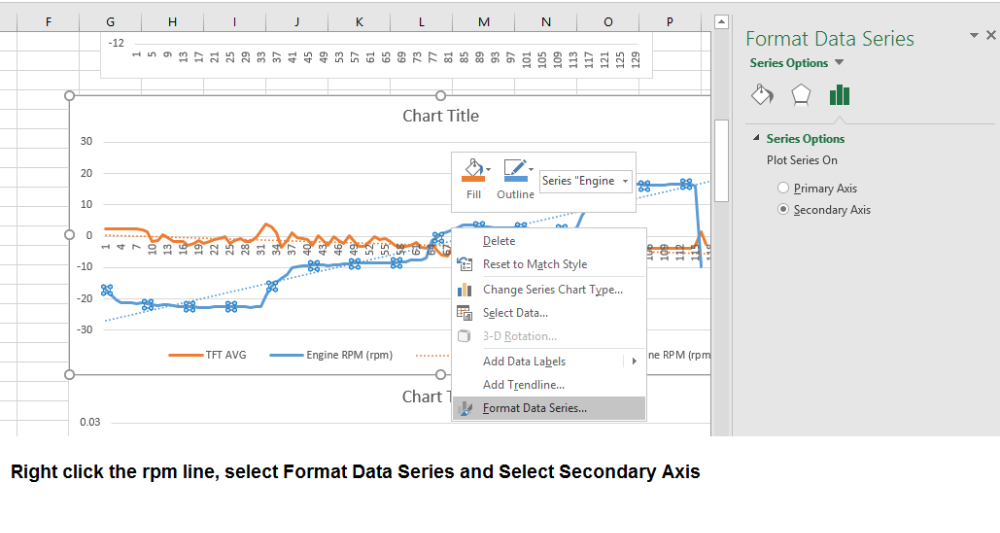
The Total Fuel Trim (TFT) ( Short term + Long term) should be within -10% to 10% on a good engine throughout all engine RPM ranges.Here is a photo of what good total trim looks like in MS Excel:
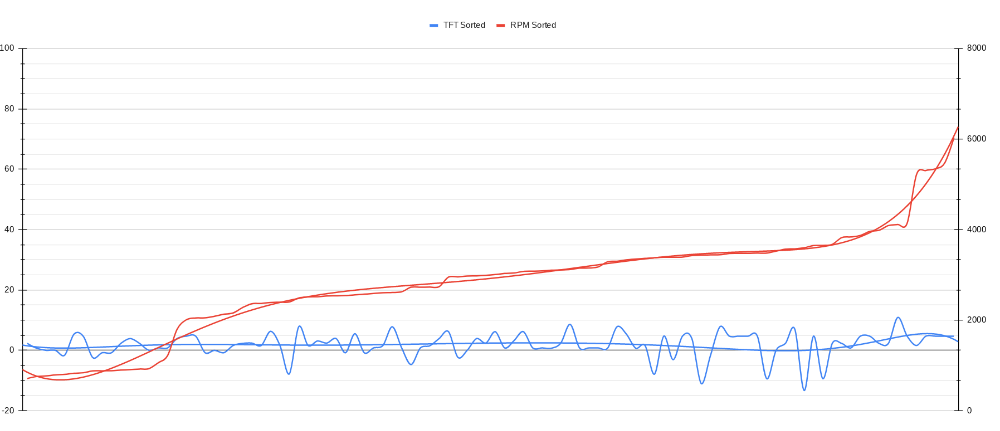
And here is a bad MAF (you wouldn't know this unless you did some VE testing, but in any case it shows a trim issue for a reason)
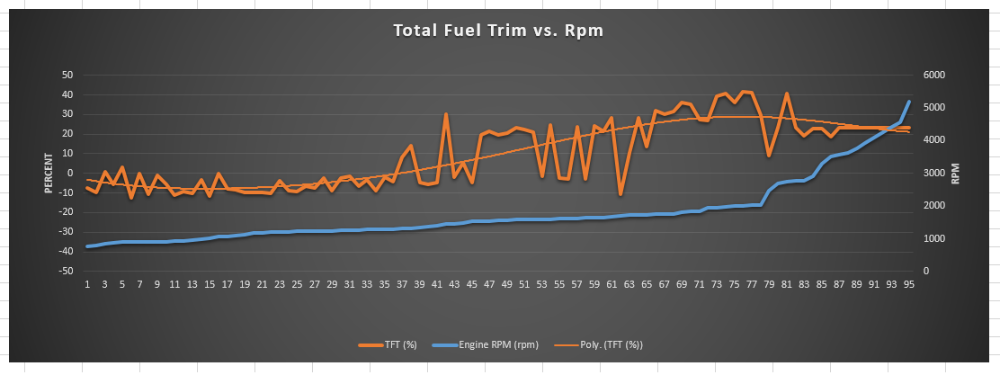
Here we can see at low engine speed we have negative trim, and as engine speed increases we go to positive trims. In this particular engines case the MAF was over-reporting at low engine speed and under-reporting at high engine speed.
Never stop Learning.
Please Log in or Create an account to join the conversation.
- SheetsTech
-
Topic Author
- Offline
- Junior Member
-
- Posts: 29
- Thank you received: 10
Please Log in or Create an account to join the conversation.
- Paul P.
-
- Offline
- Platinum Member
-
- Posts: 457
- Thank you received: 195
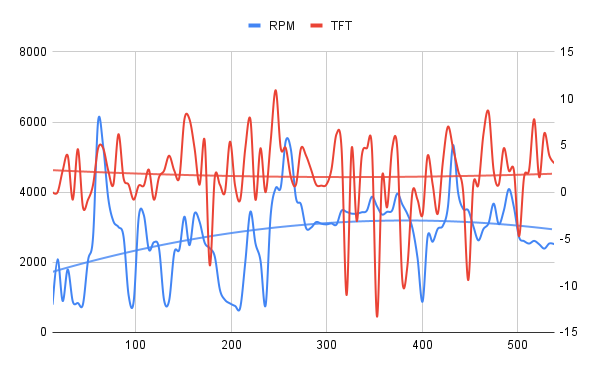
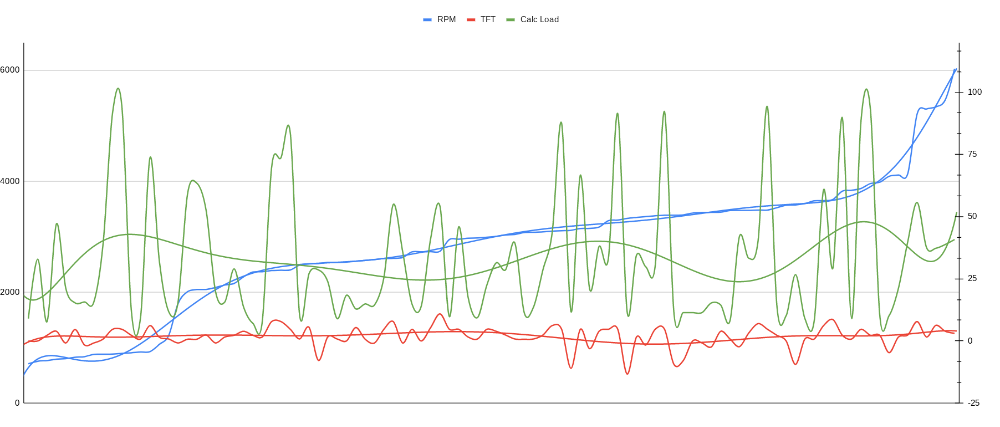
I set the right scale to secondary so it's display of RPM.
Then once I have the TFT in data table, I create a table and sort everything from low to high in the rpm. That's the trick.
So I can see from your graph you have good trim control from low to high engine rpm. On average you are +4 Percent according to your polyline.
I would say your MAF is reading Correctly, You will also note your load pids will max out @WOT. CALC LD and ABS LD.
But you have to rework your graph, because those -15 might be at low rpm.
Here is an example of a data table
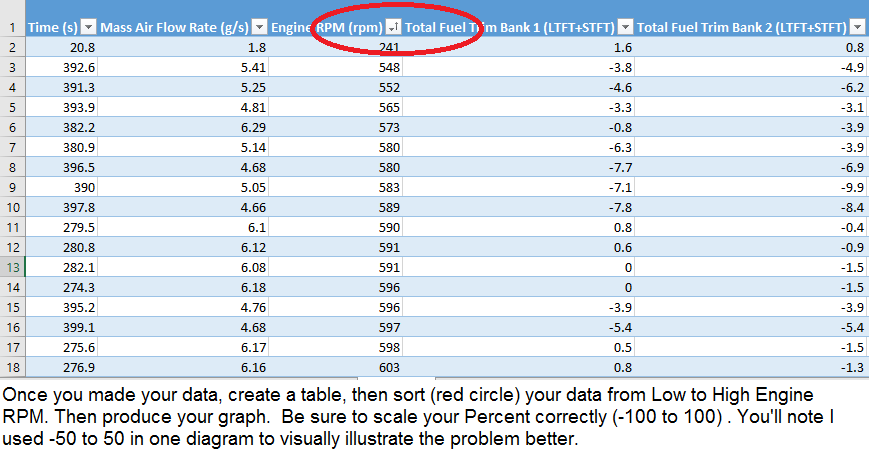
Never stop Learning.
Please Log in or Create an account to join the conversation.
- Paul P.
-
- Offline
- Platinum Member
-
- Posts: 457
- Thank you received: 195
You can add your load pids too that makes it even more apparent whether it's an Air issue.
Never stop Learning.
Please Log in or Create an account to join the conversation.
- SheetsTech
-
Topic Author
- Offline
- Junior Member
-
- Posts: 29
- Thank you received: 10
Please Log in or Create an account to join the conversation.
- SheetsTech
-
Topic Author
- Offline
- Junior Member
-
- Posts: 29
- Thank you received: 10
Please Log in or Create an account to join the conversation.
- Paul P.
-
- Offline
- Platinum Member
-
- Posts: 457
- Thank you received: 195
From the graph the highest I see is ~12 ish and the lowest is ~ -12ish.
What is the average TFT, use your spreadsheet and get an average for that column, sometimes this can be a good indiction.
Also, be mindfull of scaling, it can cause the eye to be mislead.
If I was just interested in the TFT vs.RPM with this data set I would scale the TFT +50% to -50%.
This same data set with the Load pids +100% to -100%.
Nice work!
Never stop Learning.
Please Log in or Create an account to join the conversation.
- SheetsTech
-
Topic Author
- Offline
- Junior Member
-
- Posts: 29
- Thank you received: 10
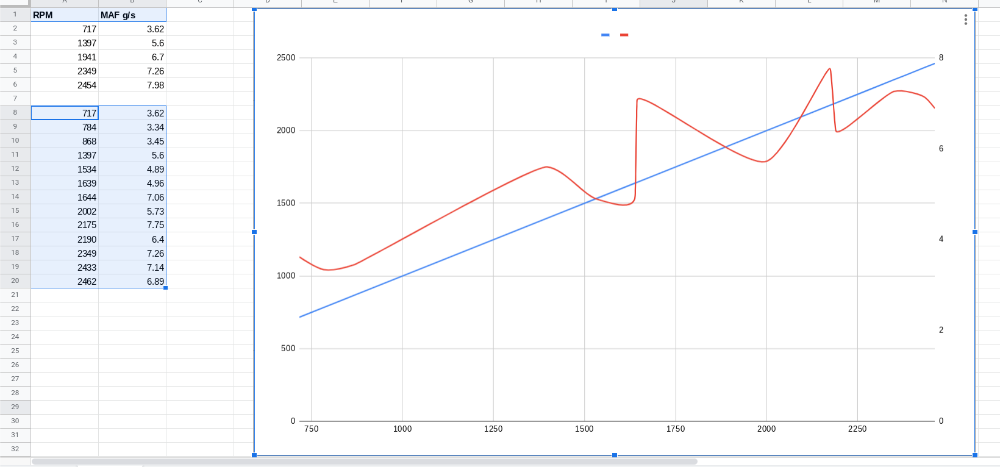
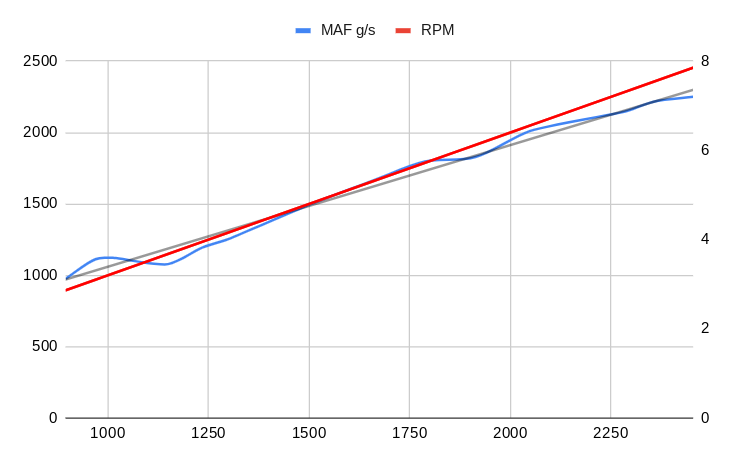
I started out by doing the volumetric efficiency test with a slow scanner. I've since learned that it records a new data point about every 5 seconds. That's like an eternity, so I've adapted. The most recent test I did is the Bosch MAF test by capturing RPM and MAF data between 1000 and 2500 RPM at 250 rpm increments. To make sure my scanner grabbed accurate data, I held each increment for 5 Mississippi and then increased throttle to the next step on up to 2500. The conclusion is my Denso MAF sensor is responding linearly like Bosch says the test will show if its good. After all that, I'm convinced the MAF is good. I still have a slightly rough idle which prompted me to dive in and learn something.
Please Log in or Create an account to join the conversation.
- Tyler
-
- Offline
- Moderator
-
- Full time HACK since 2012
- Posts: 6126
- Thank you received: 1542
Please Log in or Create an account to join the conversation.
- Paul P.
-
- Offline
- Platinum Member
-
- Posts: 457
- Thank you received: 195
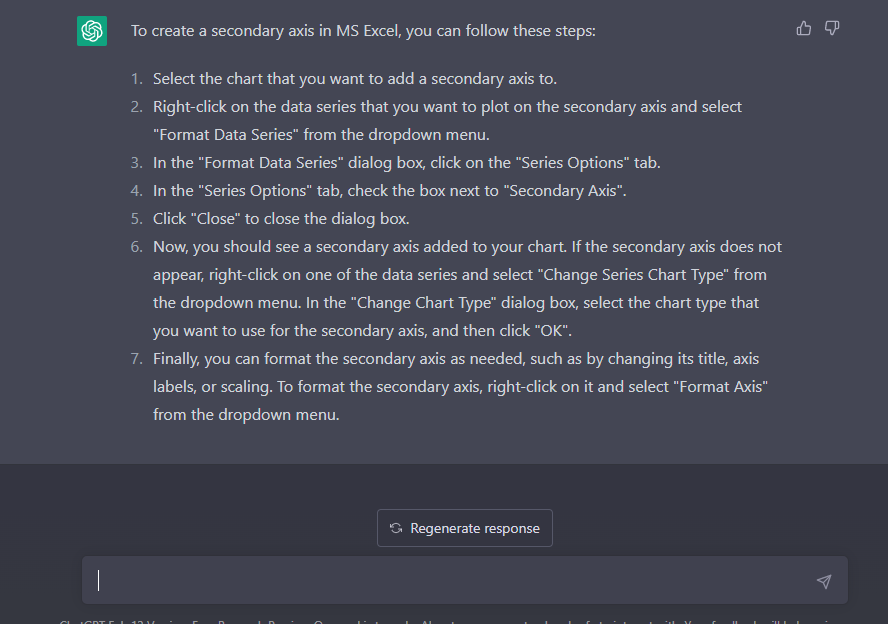
Couln't resist here is what ChatGPT says to do!!!
Tyler I googled videos and learned Excel on my own, it took time, more time than learning to use my Pico, uuuggghhh.
But this gal knows her excel stuff, she's very thorough.
www.youtube.com/@LeilaGharani
Feel free to pick my brain every once in a while
Never stop Learning.
Please Log in or Create an account to join the conversation.